VORtech contributed to a data challenge that was issued by a number of water boards in the Netherlands, together with the Department of Waterways and Public Works (Rijkswaterstaat). Our contribution, called the Watercorrelator, provides water managers with an understanding of the potential impact of their actions.

The customer
In 2017, a number of Dutch water boards together with the Department of Waterways and Public Works (Rijkswaterstaat) issued a data challenge regarding “Smart Water Management”. Water boards play an important role in the Netherlands, as they make prevent flooding and maintain the quality of the surface water.
The challenge
Water managers in the Netherlands are responsible for an extremely complex water system, where the impact of actions is not always obvious. Also, things that happen in the territory of one water board can influence events in the territory of another water board. Therefore, water managers need a better understanding of the relations between variables in and beyond their territory.
The solution
VORtechs contribution to the challenge was the WaterCorrelator: a tool that will let water managers quickly discover useful relations between variables in and beyond their territory.
The WaterCorrelator combines a large number of public and private data sets under a single dashboard. The system will determine the meaningful relations and present them to the user in an intuitive way.
The next steps
The WaterCorrelator that was built for the data challenge is a simple prototype. By order of the Department of Waterways and Public Works and the water board Brabantse Delta, we have now been elaborating on these ideas to gain insight into the relation between the water level in the Volkerak-Zoommeer and the state of the water system of the water board.
Predicting by Machine Learning
In addition to applying the WaterCorrelator, the focus is on predicting (changes in) water levels in the territory of the water board. First and foremost, it is important to include sufficient and adequate data sources, such as water levels at various locations in the past and external parameters such as precipitation, evaporation and flow rates. All these data sources can be used to train different machine learning algorithms, after which these algorithms can be used to predict.
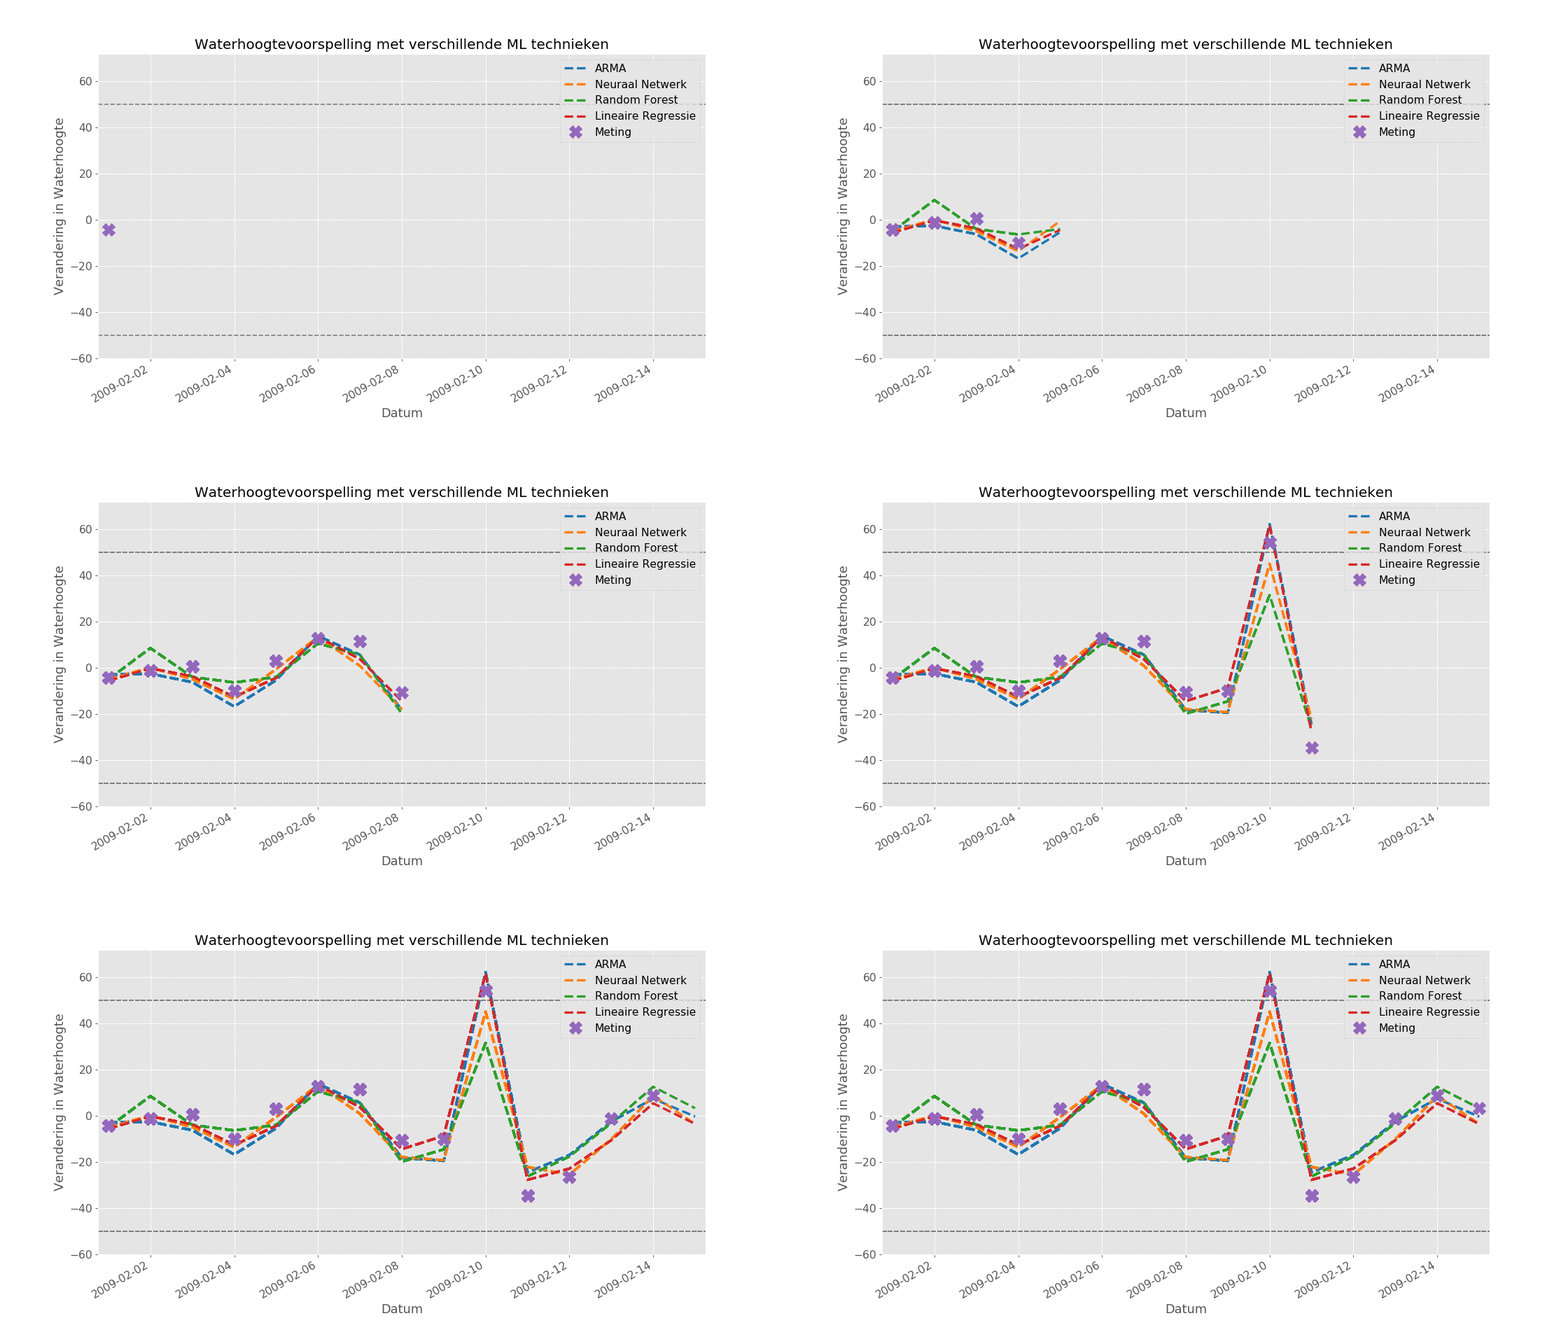
The figure below shows how we predict the change in water height with different machine learning models for a certain period of time. It is also possible to see for each day how well the prediction corresponds to the actual measurement.

With these predictions, the water manager can therefore immediately see whether there are floods or water shortages. This allows him or her to take appropriate actions (for example, opening or closing one or more sluices), so that the negative impact of such an extreme on the area is reduced.